


AI versus computing efficiency
Chart(s) of the week

I’m going to experiment a bit with a new feature here at Steel For Fuel: Charts of the Week.
The research team at my firm, Energy Impact Partners, is constantly scanning the horizon for data to help us discern the trajectory of energy and climate technology. We see a lot of charts. The plan is to share some of them here.
So, without further ado, here’s the first dispatch, adapted from “What Nvidia's Blackwell efficiency gains mean for DC operators”, by Thomas Mann at The Register.

Contrast this with the following chart, from “Training Compute of Frontier AI Models Grows by 4-5x per Year” by Epoch AI. (I believe these guys produce the best objective, data-driven analysis on the world of AI, hands down.)

Notes:
From 2020 to 2024, the energy efficiency of NVIDIA’s leading-edge GPUs improved by nearly 4X. This is a tremendous performance improvement in computing hardware. We haven’t seen this kind of energy efficiency gain anywhere else in the economy since the introduction of the LED light bulb. What’s even more astonishing is that the industry has been able to sustain this level of exponential progress for over ten years. Here’s one more chart from Epoch.
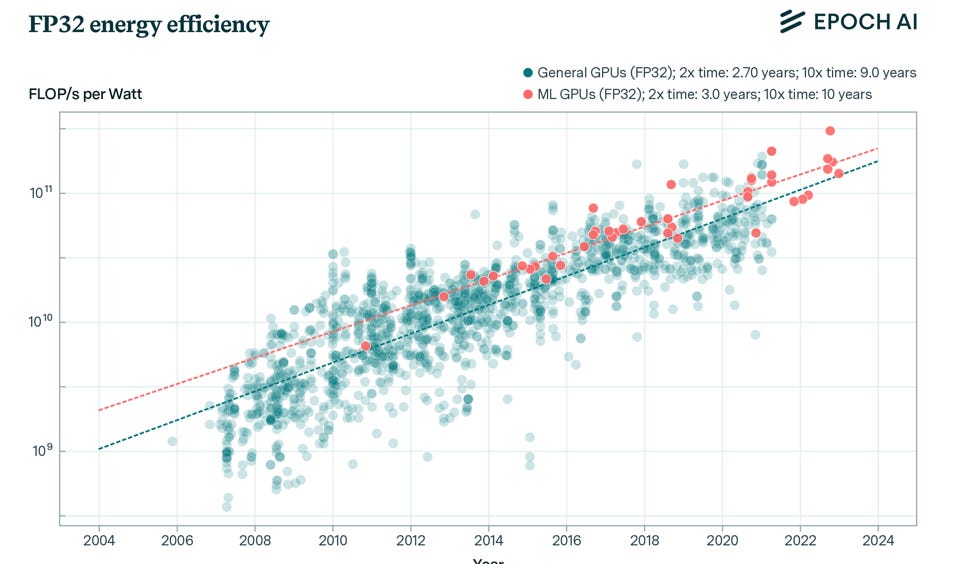
“Trends in Machine Learning Hardware”, Epoch AI, Nov 2023. And yet, despite this extraordinary progress by chip producers, performance is simply not keeping pace demand growth. From 2020-24, the computing requirements to train the leading Generative AI models increased by about three orders of magnitude (”OOMs”), or ~1,000X.
This is the reason that data center demand has suddenly become the talk of the electricity sector. Seriously, did anyone talk about anything else at this year’s Edison Electric Instute conference, in which Jensen Huang was the keynote speaker?!?
What remains to be seen is whether AI computing demand growth will really, truly continue to be measured in OOMs for years (decades?) to come, or whether expectations and investment will begin to come back down to earth. My bet is the latter, and I’m seeing more voices in the market express a similar view. But, plenty of smart people I respect are still betting that another few OOMs will make this stuff truly world-changing.

I think these graphs are only telling part of the story: they're only showing the energy used for training. If I recall correctly, there's a lot more energy used in the inference phase of operation. (For one thing, training happens rarely; inference happens all the time.) But I don't know how the energy demands of inference are changing over time. Maybe inference is scaling more slowly than training. To understand the future of AI energy use, I think you have to look at inference, too.